
Purpose: Monitor group dynamics, membership trends, and activity levels.
This dashboard helps you understand how groups are performing. Which groups are thriving, which need attention, and how group membership relates to overall engagement.
For definitions of terms used below, see the Glossary.
Overview
High-level counts for the selected group(s): how many groups, how many members, and how many of those members are active or contributing.
Groups
The total number of groups, compared with the previous period to show change over time.
Group memberships
The total number of group memberships for the selected group(s), compared with the previous period to show growth or decline.
Active users
The number of unique users who generated any activity in the selected period, limited to members of the selected group(s). Same concept as on the Community Health dashboard, but filtered by group membership. Indicates the size of the engaged member base. Compared with the previous period to highlight growth or decline in active participation.
Contributing users
The number of unique users who created content during the selected period, limited to members of the selected group(s). Same concept as on the Community Health dashboard, but filtered by group membership. Distinguishes passive activity (such as logins or page views) from active contributions (such as creating posts, comments, or topics).
Growth
Metrics that show how group membership and participation are growing over time.
Weekly participation rate (%)
The weekly active group member rate as a percentage of total group members (cumulative to that week) who were active in each week. You can use group filters to zoom in on individual groups.
Weekly contribution rate (%)
Shows the percentage of group members who contributed content each week. Highlights how engaged members are in creating discussions, posts, or other contributions, relative to the total membership size of the selected groups.
Membership growth by group
Shows which groups gained or lost the most members compared to the previous period. Highlights groups that are expanding quickly and those experiencing decline.
Trends
Metrics that highlight which groups are gaining or losing engagement and how they rank by participation.
Trending groups by activity
Highlights the groups with the strongest increase or decrease in active members compared to the previous period. Tracks where engagement is surging or falling.
High participation groups
Ranks groups by participation rate (active members divided by total members). Identifies the healthiest groups with the most engaged memberships.
Low participation groups
Ranks groups by participation rate (active members divided by total members). Identifies the least active groups that may benefit from targeted action.
Deep dives
Metrics that explore group structure, size distribution, roles, and the link between group membership and overall engagement.
No. of groups by active user
Shows how many groups each active user belongs to. Reveals whether active members tend to participate in just one group or engage across multiple groups, indicating the level of cross-group interaction within the community.
Weekly group size distribution
Shows the average, median, and 90th percentile group sizes for each week, based on the number of active members per group as of the end of that week. Only users who had not left the group by that time are counted.
Group roles
Counts the number of active members per role in the selected group(s), based on the most recent membership status for each user within the chosen time range.
Weekly active user rate: Group members vs non-members
Compares the weekly active user rate between users who have joined at least one group and those who have not. Shows how group membership correlates with higher levels of user engagement over time.
Filters
Time range
All metrics respond to the selected time range.
Groups
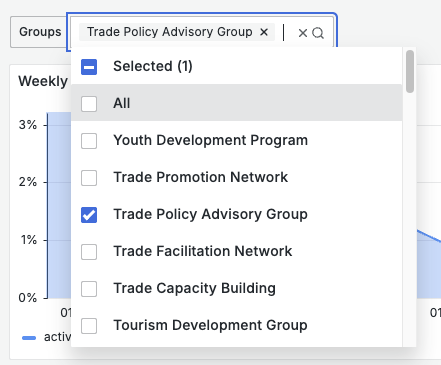
Most metrics can be filtered to focus on specific groups.