

Engagement Studio manual›Campaigns›Reports and insights
Every email, campaign and focus item in Engagement Studio collects data: who opened it, what they clicked and where they dropped off. Used well, that tells you more than how one message performed. It shows what your members care about, which groups respond and which ones need a different approach.
What you can measure
| Where | What you see | Use it to |
|---|---|---|
| Emails Channels > Emails, open an email | Sent, read and read rate, clicks per link, unsubscribes and bounces, over time | Compare subject lines and content, and see which links and topics draw members in |
| Campaigns Campaigns, open a campaign | How many members are at each step, which path they took at each decision, and how each email in the campaign performs | Find the step where members drop off and adjust timing or content |
| Focus items Channels > Focus Items | Views and clicks | Check whether a nudge on the platform leads to action |
| Contacts Open a contact | A timeline of the emails a member received, opened and clicked | Understand one member's journey, for example before a personal follow-up |
| Reports Reports > New | Your own tables and charts across emails, campaigns and contacts | Track results over time and share them with your team |
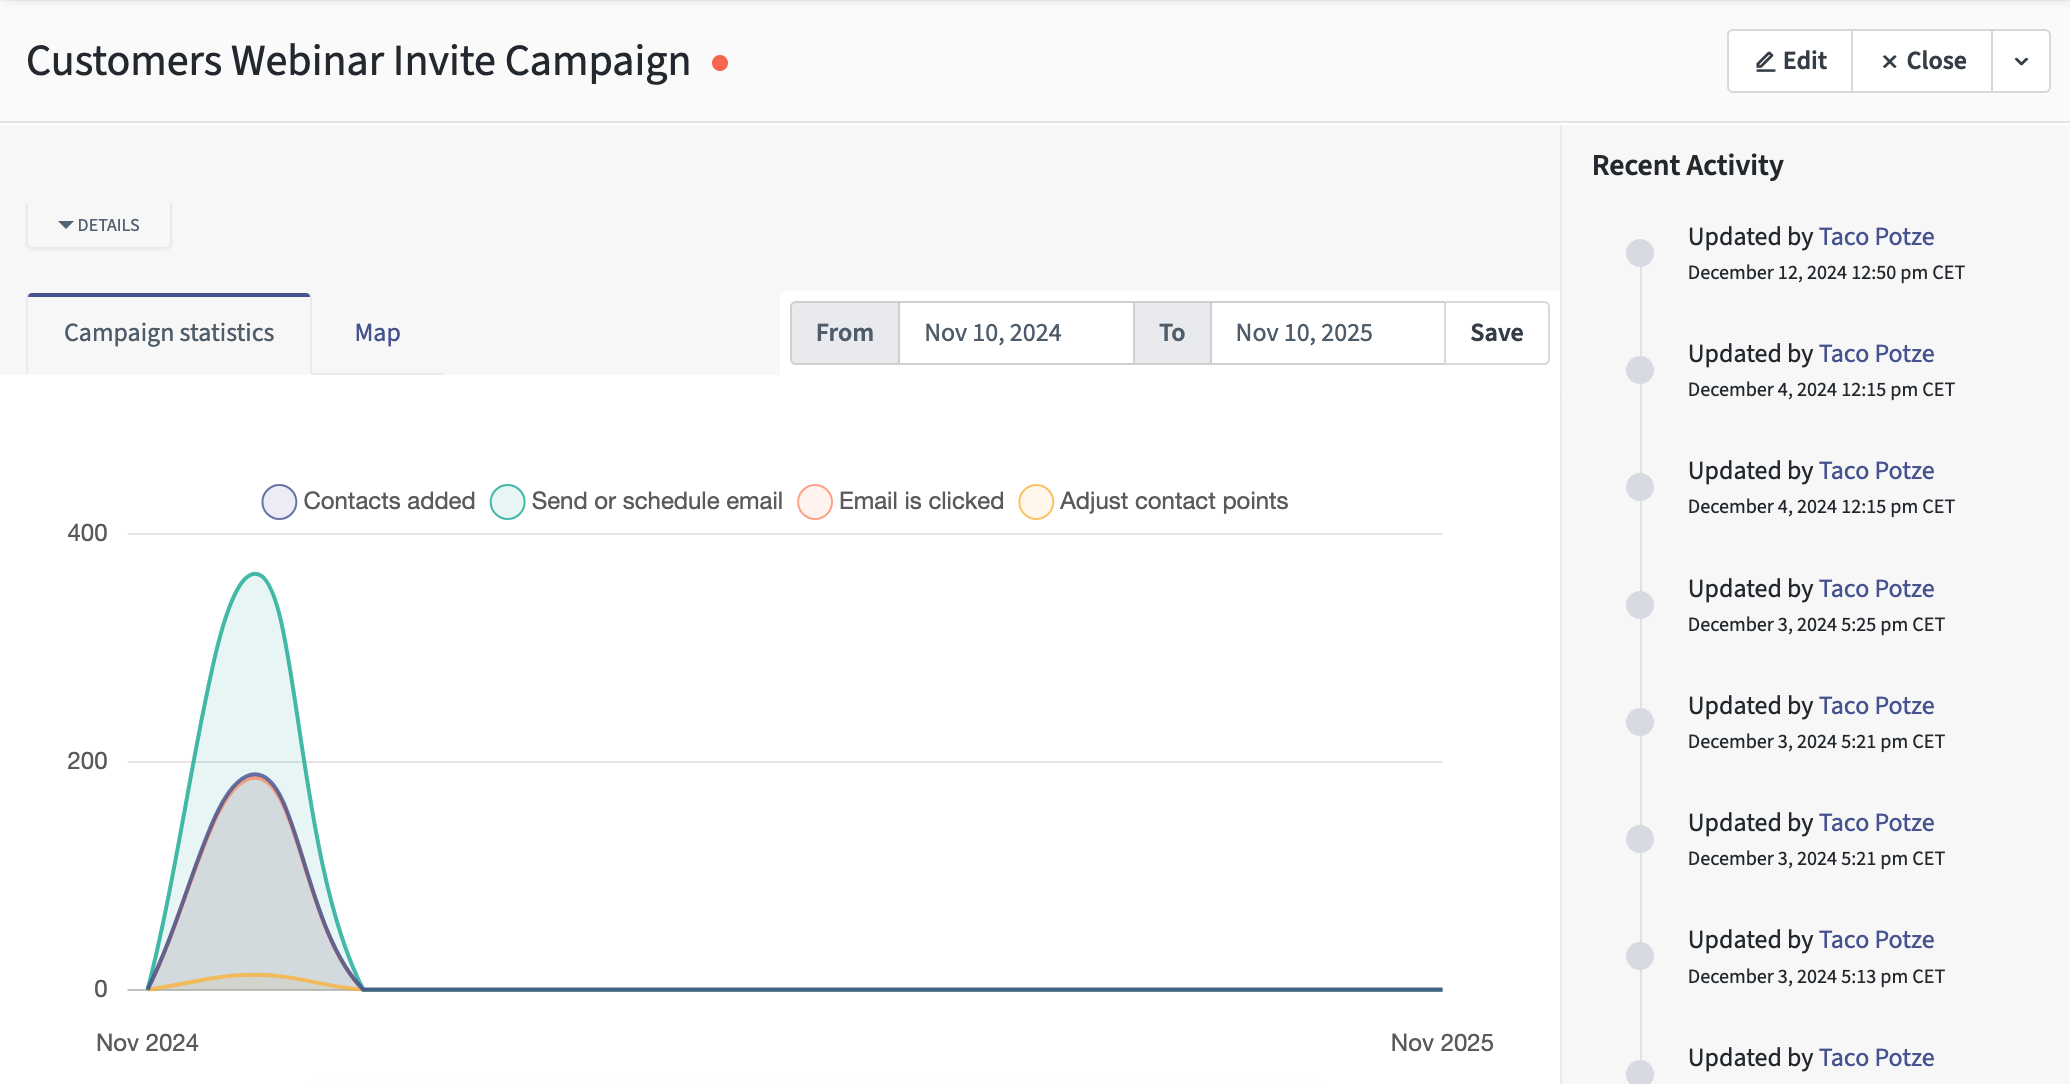
A running campaign: the number of members at each step and the results per email.
The key numbers
- Read rate: the share of sent emails that members opened.
- Click-through count: the number of unique members who clicked any link in the email.
- Click-through rate: the share of sent emails that led to at least one click.
- Click-to-open rate: the share of opened emails that led to at least one click. This shows how engaging your content is for members who did open it.
Opens are an estimate. Some email apps, such as Apple Mail with privacy protection, load emails automatically, which counts as an open. Clicks are the more reliable signal, so judge your emails mainly on clicks and click-to-open rate.
Build a report
- Go to Reports and click New.
- Give the report a name and choose a data source, for example Emails.
- Pick the columns you want, such as read rate, click-through rate and click-to-open rate.
- Add filters (for example one campaign or a date range) and, if you like, a graph.
- Save. You can export the report to a spreadsheet, or schedule it so it arrives in your inbox regularly.
Turn insights into engagement
- Follow the clicks. The links members click show which topics, events and groups matter to them. Use that for your next newsletter or to decide which group to promote.
- Act on silence. Members who stop opening are a segment in their own right. See Reaching inactive users.
- Test one thing at a time. Change the subject line, the send time or the first sentence, and compare the click-to-open rate.
- Look at the drop-off. In a campaign, the step where most members stop is where a shorter message, a better moment or a focus item can help.
- Combine with your community data. Engagement Studio shows how members respond to messages; Lumina Insights shows what they do in the community itself.
Engagement Studio is built on Mautic. For all report options, see the Mautic documentation on reports.
← Previous: Finalising and managing campaignsBack to the Engagement Studio manual